Mitochondrial Testing
A vital dimension in diagnosing cellular health
Our mitochondria are key orchestrators of cellular health, responsible for our energy production, biosynthesis of cellular components, and cellular signalling. Measuring the activity and capacity of relevant mitochondrial and cellular parameters can be of huge benefit in deciding on the appropriate protocol for a patient.
AONM has gone into partnership with a laboratory in Germany that performs some extremely sophisticated and well-researched mitochondrial tests including using extracellular flux analysis with the Seahorse XF (please see “Energy pathways” video below) to perform these analyses.
For more information about Professor Koenig who runs the lab please click here.
What tests are available?
Order OnlineTest 1. ATP profile
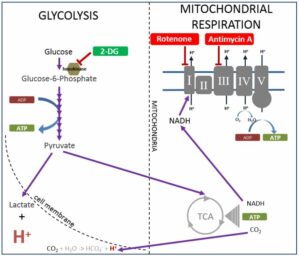
The ATP Profile determines the total ATP production and allows for a quantitative comparison of the cells’ energy engines – mitochondria and glycolysis – in a basal state. A diagram of the cellular pathways that this test analyses is shown below:

Figure 1 modified from Pelletier, M., Billingham, L., Ramaswamy, M., & Siegel, R. (2014). Extracellular flux analysis to monitor glycolytic rates and mitochondrial oxygen consumption. Methods in enzymology, 542, 125-49.

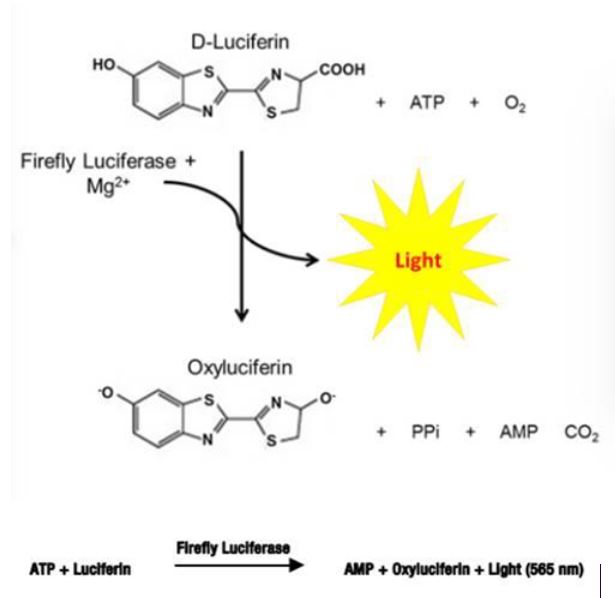
Figure 2. One-Step Luciferase Assay System
The ATP Profile consists of the following markers:
a) Total ATP
This is the quantity of ATP that the cells produce at rest via both mitochondrial and non-mitochondrial pathways. Total ATP is all the adenosine triphosphate (our cells’ energy currency) available to the cell. This makes it possible to assess the relative performance of mitochondrial respiration (mitochondrial ATP capacity) versus anaerobic glycolysis (glycolytic ATP capacity).
b) Mitochondrial ATP capacity
“Mitochondrial ATP capacity” (See Figure 1 above) measures the capacity to synthesise adenosine triphosphate (ATP) in the patient’s mitochondria in a defined basal state. This is calculated by determining the absolute ATP production that is inhibited by addition of the ATP synthase inhibitor oligomycin (see figure above). Mitochondrial-generated ATP, if production is functioning smoothly, has a very high harvest: ~34 ATP from one molecule of glucose, and far more from fats (e.g., ~ 146 ATP from one molecule of oleic acid). The metric is given as both a percentage and in femtomoles/cell. Lower than optimal ATP capacity suggests various possible dysfunctions (see below for list).
c) Glycolytic ATP capacity
ATP can also be produced in the cytosol, outside the mitochondria (though still inside the cell). This is produced largely from glucose, and the amount of ATP per molecule of glucose is very low (just 2 ATP per molecule of glucose). This parameter measures the glycolytic capacity for ATP production: the maximum quantity of ATP that the cells are able to produce at rest via non-mitochondrial pathways, i.e. anaerobic glycolysis. This makes it possible to assess the relative performance of anaerobic glycolysis versus mitochondrial respiration. This metric, again, is expressed as a percentage as well as in femtomoles/cell.
d) Reserve ATP capacity
ATP synthesis is generally presumed to be coupled almost entirely to two metabolic processes: oxidative phosphorylation and glycolysis. There is however another essential metabolic process that interconverts the three adenine nucleotides (ATP, ADP and AMP) using adenylate kinase according to metabolic needs. Adenylate kinase catalyses a reversible reaction: 2 ADP > ATP + AMP. This is a vital factor in regulating the energy charge in cells, providing an open system able to accept, store and supply energy to cells as needed. The marker “Reserve ATP capacity” indicates how dynamically the cell is able to perform this catalytic interconversion.
************
If some of these parameters are out of range, it may be useful to perform further testing, such as appropriate biochemical tests to investigate what may need to be addressed, e.g. heavy metals/contaminants (Hg, Al, glyphosate, Bisphenol A, PCBs, etc.), infections (such as Borrelia, viruses), deficiencies in mitochondrial substrates (B vitamins, CoQ10, magnesium, etc.). It may also be helpful to measure fatty acid composition, and markers of redox status (glutathione metabolism, superoxide dismutase, etc.).
There are of course specific nutrients that support mitochondrial function, and a practitioner/doctor can advise you on which are most appropriate depending on the results and other factors.
Test 2. Mitochondrial Health Index
The Mitochondrial Health Index (MHI) is an index composed of all the parameters below, based on the science developed at the University of Alabama that went into the evolution of this metric and the Seahorse XF measurements.
(Source: Chacko BK, Kramer PA, Ravi S, Benavides GA, Mitchell T, Dranka BP, Ferrick D, Singal AK, Ballinger SW, Bailey SM, Hardy RW, Zhang J, Zhi D, Darley-Usmar VM. The Bioenergetic Health Index: a new concept in mitochondrial translational research. Clin Sci (Lond). 2014 Sep;127(6):367–73; https://pubmed.ncbi.nlm.nih.gov/24895057/). It can be used to measure improvement in mitochondrial function, and to help identify where the block to optimal functioning might lie.
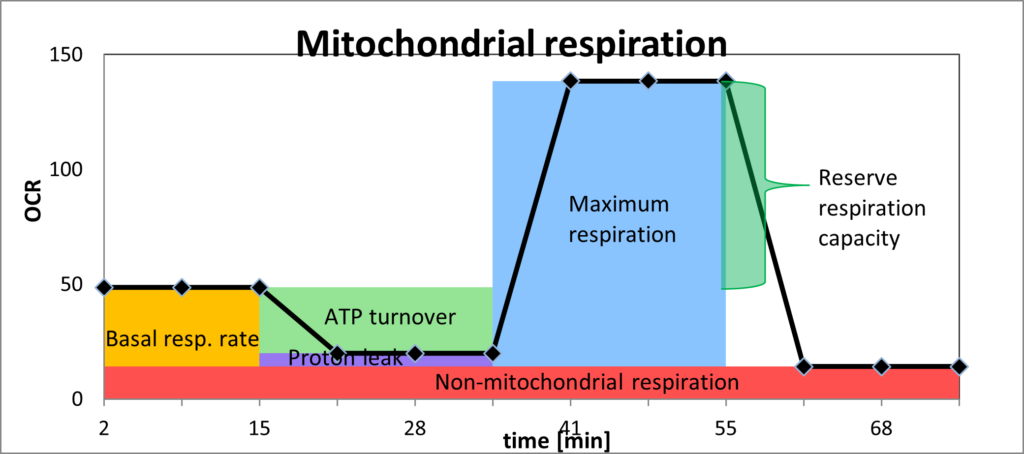
The main parameters used are illustrated below:
______________________

OCR = oxygen consumption rate
1) Basal respiration rate (orange)
This parameter shows how much oxygen is being used in the mitochondria in the mitochondria at rest (in pmol O2/min). If the basal oxygen consumption is high at rest, without the mitochondrion being intentionally put under stress, this suggests that the mitochondrion is having to address specific challenges, e.g. inhibitors of individual complexes of the electron transport chain (heavy metals, for example), toxins such as pesticides or lipopolysaccharides, and/or oxygen radicals.
2) ATP turnover (light green)
This is the rate of mitochondrial ATP synthesis in a defined basal state after the proton leak has been deducted.
3) Coupling efficiency/proton leak (purple)
A proton leak is a physiological process in which oxidative phosphorylation is uncoupled from ATP synthesis, and energy is dissipated as heat. Coupling efficiency is the proportion of the oxygen consumed to drive ATP synthesis compared with that driving proton leak. The cause of reduced coupling efficiency is a proton leak. An increase in proton leak is consistent with the mitochondria becoming less efficient. The causes of a proton leak include a) high concentration of damaging free radicals; b) insufficient antioxidants; c) inhibitors of ATPases, including ATP synthase; d) suboptimal mitochondrial membrane integrity.
4) Non-mitochondrial respiration (red)
This parameter is an index of oxygen-consuming processes that are not mitochondrial. In leucocytes, the non-mitochondrial respiration rate is typically due to enzymes associated with inflammation, including cyclooxygenases, lipoxygenases and NADPH oxidases. It is generally raised in the presence of stressors, including reactive oxygen species (ROS) and reactive nitrogen species (RNS). An excessive level is regarded as a negative indicator of mitochondrial health.
5) Maximum respiration (blue)
This is measured by putting the cell under stress, into a (standardised) state of increased energy demand. This reveals the maximum oxygen consumption that can take place at Cytochrome c oxidase (Complex IV). Lower than expected maximum respiration is an indicator of mitochondrial dysfunction: the mitochondria should be capable of expanding their capacity when under energy demand.
6) Reserve respiration capacity (darker green)
The difference between the basal respiration rate and maximum respiration rate is the reserve capacity of the mitochondrion, which is a measure of the maximum potential respiratory capacity the cell can utilise under conditions of stress and/or increased energetic demand. The lack of reserve respiratory capacity indicates a mitochondrial dysfunction that may not be apparent under basal conditions. Causes of a limited ATP reserve are a) insufficient ability to utilise fuels (glucose, fatty acids); b) reduced mitochondrial mass (shown by ratio of mitochondrial DNA to nuclear DNA); c) dysfunctional complexes of the electron transport chain; d) altered metabolic status as a result of infection (viral, bacterial), anti-tumour immune responses, autoimmune disease, etc. The Cell Danger Response may trigger this for example, where more oxygen needs to be utilised in the cytosol, and therefore less is available to the mitochondria, even when stress is put upon the cell and more energy is needed.
7) Energetic phenotype
Differentiating ATP generation from glycolysis and oxidative phosphorylation is vital for cellular bioenergetics but has traditionally been hard to quantify. The Seahorse XF is able to calculate the ratio of ATP generation by each pathway from simultaneous measurements of extracellular acidification and oxygen consumption in the basal state as well as on energy demand. The MHI results give a ratio of oxygen consumption to glycolysis on energy demand, and the percentage the cell is using of the one versus the other, as percentages of what it should optimally be capable of.
8) Calculation of the MHI
The Mitochondrial Health Index itself is calculated from the various parameters measured in the test, as follows:
MHI = log (reserve capacity) x (mitochondrial ATP turnover)
(non-mitochondrial) x (proton leak)
The figure calculated for the MHI provides a marker against which the impact of therapy can be measured. For further information, please refer to the seminal article by Chacko et al. (Chacko et al. The Bioenergetic Health Index: a new concept in mitochondrial translational research. Clin Sci (Lond). 2014 Sep;127(6):367-73; https://pubmed.ncbi.nlm.nih.gov/24895057/.).
It was on the basis of the work of Chacko et al at the University of Alabama that this metric was developed. It is well substantiated and recognised internationally: these metrics and testing techniques have been used in over 7,000 peer reviewed studies and publications to date around the world. (https://www.agilent.com/search/?N=4294836537; https://seahorseinfo.agilent.com/acton/media/10967/agilent-cell-analysis-publications-alert-january-2021.
Supplementary Biomarkers
Group A:
Ratio of mtDNA to nDNA (mtDNA:nDNA)
Mitochondria have their own genome – their own DNA. The ratio of mtDNA (mitochondrial DNA) to nDNA (nuclear DNA) makes it possible to calculate the number of mitochondria per cell. This ratio can be used as a marker of mitochondrial dysfunction, because a decline indicates that replication (mitobiogenesis) is not occurring, and that mitochondrial numbers are decreasing. This is a sign of cellular distress that may be due to toxins, infection, inflammation, or a number of different causes. Various metabolic and neurodegenerative diseases are associated with reduced numbers of mitochondria, which also lead to ATP deficiency:
https://pediaa.com/difference-between-mitochondrial-dna-and-nuclear-dna/
PGC-1α
PGC-1α (Peroxisome Proliferator-Activated Receptor Gamma Coactivator-1Alpha) is of central importance for the induction of mitochondrial biogenesis: the development of new mitochondria. This makes it a key enzyme for our energy metabolism. PGC-1α is also a transcriptional coactivator, meaning it interacts with many transcription factors that are involved with numerous biological processes: it is a regulator of thermogenesis, gluconeogenesis, the beta-oxidation of fatty acids, of hormone metabolism and our antioxidative system. The level of this in the mitochondria compared to other indicators is therefore very significant and instructive.
One recommended combination is mtDNA:nDNA and PCG-1α, as these cast light on each other very well, both being involved with mitobiogenesis.
Nrf-2
NRF-2, nuclear factor erythroid 2-related factor 2, is the master regulator of our antioxidant system to protect cells from reactive oxygen species. Nrf-2 activates Phase II detoxification – particularly glutathione-S-transferase and other antioxidant enzymes, including SOD-2, catalase and glutathione peroxidase. It is crucial to have adequate levels of this in the mitochondria.
Mitochondrial 4977 deletion mutant (mt4977del)
Among mtDNA deletions, one of the most vital that causes huge destruction of almost one third in length of the mitochondrial genome is the 4977-bp mtDNA deletion (mDNA4977). This is one of the best-described large-scale mtDNA deletions, and has been found to accumulate in numerous disorders (literature available upon request). It is often known as a “common deletion” due to the frequency with which it has been reported. The deleted region encodes seven polypeptides essential for the OXPHOS pathway: four for Complex I, one for Complex IV, and two for Complex V. This can cause complete failure of ATP production in the mitochondria affected.
This is not an inherited polymorphism: it arises due to endogenous and exogenous factors, especially oxidative stress. This is why checking for it can be very useful, as measures can be taken to reduce the levels, and repeat tests do document a decline in levels if the initiatives are successful.
Nrf-2 and mt4977del are recommended to be done together, as they are both very connected with oxidative stress.
Lactate/pyruvate ratio
Glucose in cells is converted to pyruvate, and can then be converted to lactate in the cytoplasm or transported into the mitochondria via the pyruvate dehydrogenase complex (PDC). The higher the value of lactate compared to pyruvate, the more glycolysis is occurring. A higher level of pyruvate compared to lactate is a prerequisite for successful transfer of substrates in the mitochondria for oxidative phosphorylation.
An increase in lactate may signify impaired mitochondrial function, or the result of excess glucose increasing glycolytic flux to an extent that preferentially shunts pyruvate to lactate instead of entering the mitochondria. Conversion of pyruvate to lactate blocks further ATP production. So the pyruvate/lactate ratio gives an important indication of how efficiently the mitochondria are working (see Figure below):

Figure 3. https://www.agilent.com/cs/library/usermanuals/public/103344-400.pdf
The pyruvate/lactate ratio can also provide information on the extent to which the mitochondria are able to utilise fatty acids for energy production. This calculation involves comparing the rate of oxygen consumption to the rate of extracellular acidification alongside the pyruvate/lactate ratio.
Group B:
Number of mitochondria
Intact mitochondria
Non-intact mitochondria
(These results will always be interpreted according to their context.)
How are the tests conducted?
AONM is working with a laboratory in Magdeburg, Germany, called MMD, Magdeburg Molecular Detections that specialises in mitochondrial testing. The ATP Profile measures ATP capacity via a chemiluminescent (light) reaction using a Luciferin/Luciferase reagent. MMD is also a pioneer in the use of the Seahorse XF. Seahorse Biosciences has developed a unique extracellular flux analyser that is able to measure multiple parameters in the cell and mitochondria with huge precision. They use a microplate-based system with unprecedented throughput to make these measurements very sensitively, with extremely rapid kinetics. This technology has come to be considered the gold standard for measuring mitochondrial function in cellular systems. Since its introduction in 2006, Seahorse XF technology has been used in over 7000 peer-reviewed publications. See these videos below for the full explanation:
HOW TO ORDER
The tests are carried out in Germany, and the samples (1-2x CPDA S-Monovette) must be shipped on the day of the blood draw. AONM supplies the test kit and shipping documents. You can order from our online shop or alternatively email info@aonm.org to request a test kit and instructions on how to prepare the sample.
Download the order form here.
oooOOOOooo
